Performance metrics measure how efficiently a workflow, system, or experience actually functions. These metrics help teams understand:How long tasks takeWhere users drop offWhere errors increaseHow much effort workflows requireWhether systems perform reliably under real usageProduct teams often focus heavily on whether users completed a task. But completion alone rarely explains how difficult the experience actually was.Users may:Finish onboarding while struggling the entire timeComplete checkout after repeated errorsUse AI recommendations while constantly double-checking resultsFinish tasks successfully while moving much slower than expectedThis is why performance metrics matter. They help teams understand the operational health of the experience underneath the workflow itself.Glare Performance MetricsInside Glare, performance metrics are organized into several measurement areas that help teams evaluate workflow efficiency and operational reliability.These metrics help teams identify:Slow workflowsRepeated errorsUnnecessary effortReliability issuesAbandonment patternsOperational bottlenecksTogether, these metrics help teams understand how well the experience functions during real usage.Error RateMeasures the percentage of users who encounter errors while performing tasks, providing insight into potential friction points in the user experience.Visit FrequencyTracks how often users return to the platform within a given time frame, providing insight into user engagement and retention.Click-Through RateTracks the percentage of users who click on a link, helping gauge the effectiveness of email campaigns, buttons, or other actionable elements.Error FrequencyCaptures how often users encounter errors during their interactions, highlighting areas of improvement for system reliability.Bounce RateIndicates the percentage of users who leave after visiting a page without interacting further, offering insight into the effectiveness of content engagement.RecencyMeasures the time since a user’s last visit, helping track the freshness of user engagement with the platform or product.Completion RateMeasures the percentage of users who fully complete a task or process, such as filling out a form or survey, providing insight into usability and task flow.Session DurationCaptures the average time users spend during a session, reflecting how deeply engaged they are with the content or platform.Abandonment RateTracks the percentage of users who start but do not finish a task, such as a checkout process, indicating where users lose interest or face obstacles.Drop-off RateTracks the percentage of users who leave a process or task at a specific point before completion, indicating areas where friction may cause users to abandon the task.Time on TaskMeasures the average time users spend completing a specific task, reflecting efficiency and ease of task completion.Why Performance MetricsPerformance metrics help teams understand how efficiently workflows actually function during real usage. They reveal the operational side of the experience by showing where friction slows users down, where workflows become harder to complete, and where systems quietly create extra effort underneath the surface.These metrics help teams identify workflow problems earlier before:Frustration spreadsOnboarding weakensAdoption slowsSupport requests increaseOperational friction becomes harder to unwindOver time, performance metrics help teams understand not just whether users completed the experience, but how difficult the experience was to successfully move through.Performance Metrics Reveal Workflow EfficiencyPerformance metrics help teams understand how well workflows function during real usage. A workflow may appear visually clean and easy to navigate while operationally creating:Extra effortRepeated errorsSlow completionUnnecessary frictionFor example:Onboarding may require too many stepsSearch workflows may slow users downDashboards may overload users with informationAI systems may create more review work instead of saving timeThese problems often become visible through performance signals before teams fully recognize the workflow breakdown. Without performance metrics, teams may only notice problems after:Abandonment risesOnboarding weakensSupport requests increaseWorkflow fatigue spreadsAdoption slows downPerformance metrics help teams identify those problems earlier before friction spreads further across the product.Performance Metrics Measure The Cost Of FrictionBehavioral metrics explain what users do. Attitudinal metrics explain how users feel. Performance metrics explain how efficiently the system actually functions underneath the experience. This includes:TimeEffortErrorsReliabilityWorkflow efficiencyOperational breakdownsFor example:Users may complete onboarding successfully but take far too longAI-assisted workflows may increase activity while slowing decision-makingUsers may repeatedly recover from small errors during checkoutDashboards may create cognitive overload that slows task completionPerformance metrics help teams understand the hidden operational cost of friction across workflows and systems.Performance Metrics Help Teams See Hidden ProblemsPerformance metrics often reveal problems that isolated success metrics fail to explain clearly. For example:High completion + long time on task may reveal frictionLow error rates + weak confidence may reveal hidden confusionStrong engagement + high effort may reveal workflow fatigueSuccessful onboarding + repeated recovery behavior may reveal usability breakdownsThe metrics begin explaining how efficiently the workflow actually performs underneath the surface. Over time, these patterns help teams identify:Operational frictionWorkflow inefficiencyReliability problemsAI workflow slowdownsOnboarding bottlenecksDashboard overloadRepeated recovery behaviorThis helps teams understand not just whether users finished the experience, but how difficult the experience was to complete successfully.Performance Metrics Become Stronger Alongside Other MetricsPerformance metrics become much more valuable when paired with behaviroral and attitudinal metrics. A workflow may technically perform well while users still:Feel frustratedHesitate repeatedlyLose confidenceStruggle to understand what to do nextFor example:High completion + low trust may reveal a fragile workflowLow errors + rising frustration may reveal exhausting interactionsFast onboarding + weak comprehension may reveal shallow understandingThe combined signals help teams understand:How the workflow performsHow users behave inside itHow the experience feels while using itOver time, these connected patterns help teams compare workflows more clearly, reduce operational friction, improve onboarding, and strengthen product decisions across the system.Take This Further with the UX Metrics AI SkillsPerformance metrics tell you what users are actually doing. TheUX Metrics AI Skillsis a package you load into your LLM so you can ask questions and get expert answers anytime.Find out which performance metrics matter most for your productSet baselines and know when a number is actually goodConnect performance data to design decisionsTurn raw numbers into findings your team can act onDrop it into your LLM and start asking questions right away.
Performance Metrics
Related links

Walks through key UX metrics like task completion rate, time on task, and error rate, plus tools to track them. Useful when a product team wants concrete metric definitions and a way to plug them into analytics.
Teresa Hudson connects e-commerce UX metrics (task time, error rate, completion) to conversion and sales so design earns a seat with stakeholders. Useful when designers need to translate UX work into business language.
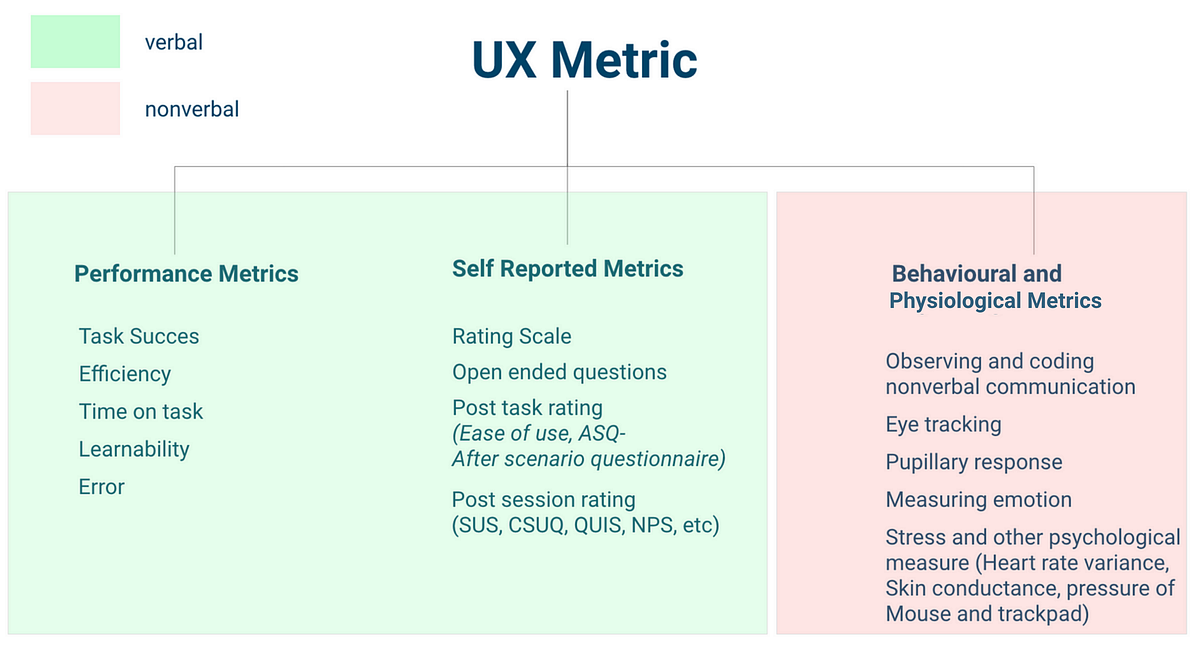
Walkthrough of the main types of UX metrics and when to use each. Useful when you need a tour of metric types before picking your set.
Identify where decision quality breaks down
The Glare Design Assessment helps teams spot weak validation, stakeholder friction, alignment gaps, and assumptions that scale without measurable learning—so you have a clearer starting point for improvement.
About 5 minutes · Team-based · Diagnostic snapshot you can act on
Take the Design Assessment